The shape of the ladder: what unlocks what in primary learning
The Learning Map's 3,221 prerequisite links aren't decoration — they form long chains, and the shape of those chains says something practical about helping a child who's stuck.
Every connection on the map is typed (must come first or helps) and carries a written reason. Follow them end to end and you get a picture of primary learning not as a checklist but as a ladder — and the ladder is taller than most people expect.
Chains run 28 deep
The longest chain on the map runs 28 steps in Science, ending at relative motion; Mathematics runs to 27, ending at scatter graphs. A capability that looks like "one topic" in an upper-years classroom can sit atop two dozen dependencies reaching all the way back to age 4.
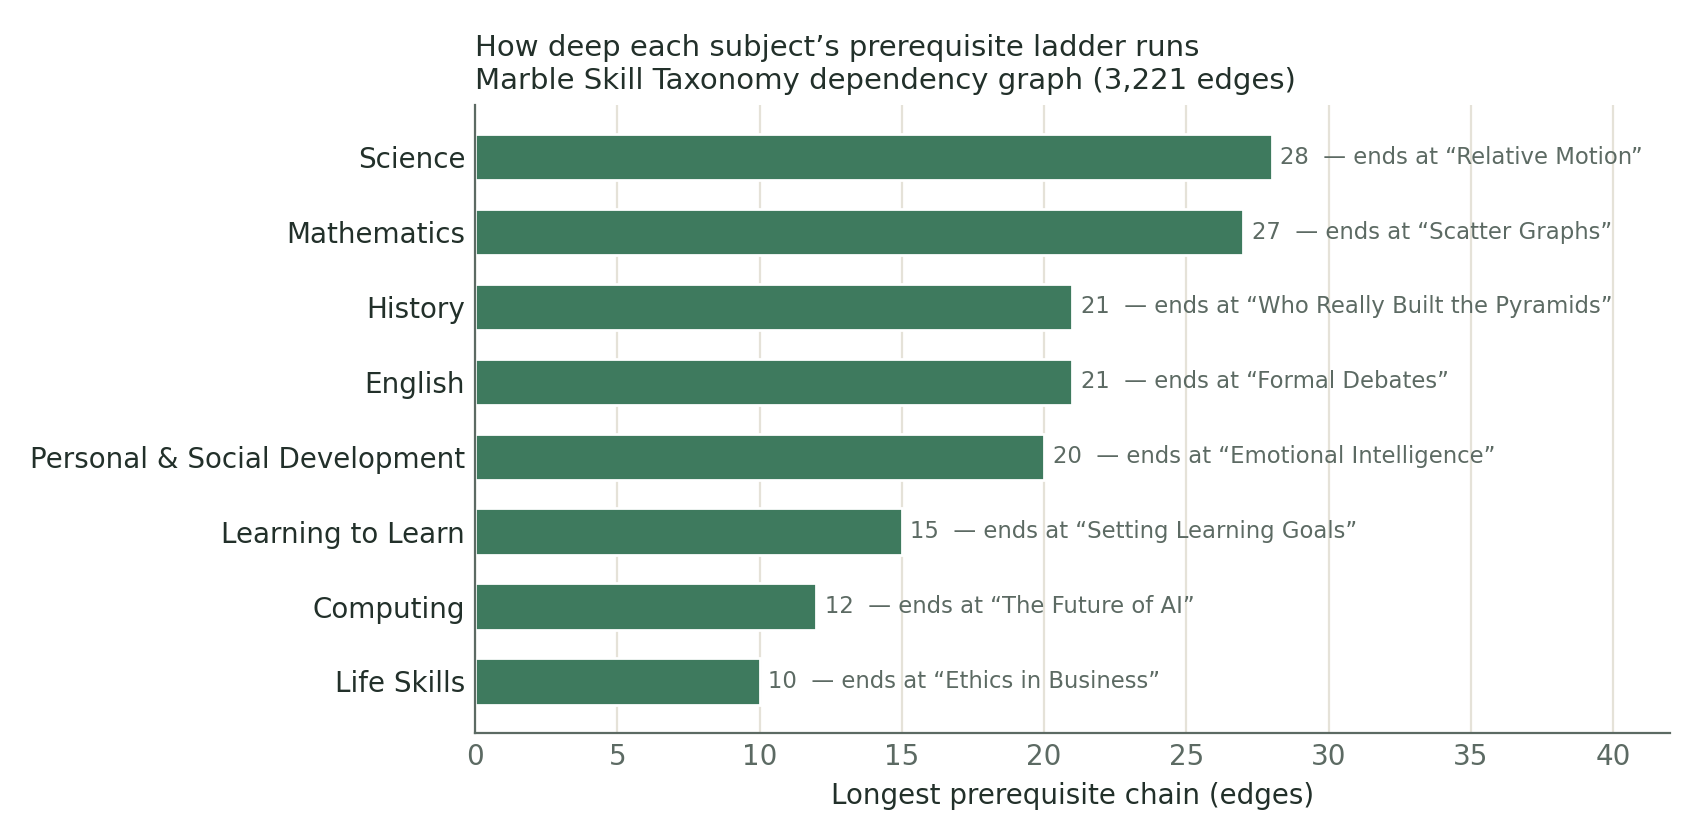
This is why "behind in Year 5 maths" is rarely about Year 5 maths. When a chain is 27 links long, the wobbly rung is usually several steps down — and the map's job is to make stepping back feel like navigation, not failure. Every skill page shows exactly what it builds on, with the reason spelled out.
The skills that buy the most
Flip the question: which skills unlock the most downstream learning? The graph's answer is unglamorous and unanimous — foundational literacy and numeracy.
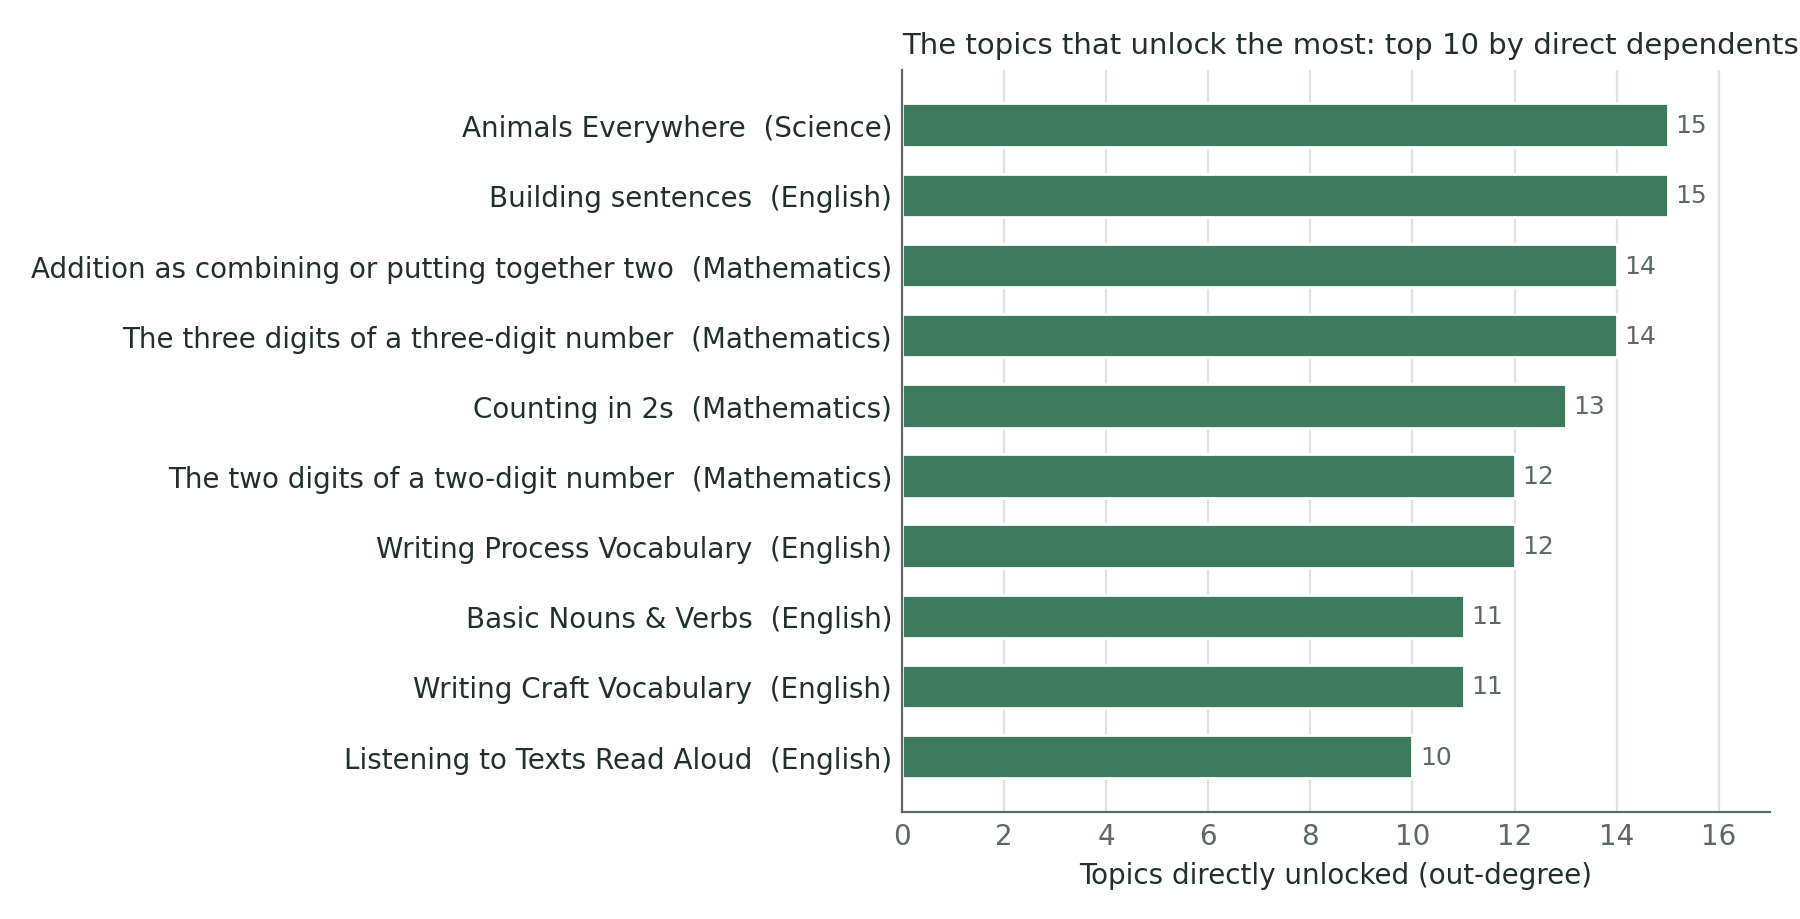
Animals everywhere (the gateway to the map's huge living-world strand) and building sentences each directly unlock 15 skills. Addition as combining and three-digit place value unlock 14 each; counting in 2s unlocks 13.
If you can only shore up a few things for a learner, the graph is unambiguous: early sentences, counting and place value buy the most. Nothing exotic — but it's useful to see the folk wisdom confirmed by 3,221 hand-written edges rather than asserted.
Ages are typical, not deadlines
One caution the data itself teaches. The chains show that skills have order, and order is what matters — the ages attached to each skill are just the typical range where children meet it. A child working "below age level" on a long chain isn't behind schedule; they're at a particular rung, and the next rung is knowable. That's the map's whole premise: start from your child's age if you like, but navigate by what they've actually got.
What does this actually mean?
If your child is stuck: don't drill the thing they're stuck on — check the rungs underneath it first. Every skill page lists exactly what it builds on, with the reason written out. Nine times out of ten the fix lives a step or two down the ladder, and it's usually quicker to repair than the thing above it.
If you're deciding what to practise: when time is short, the graph's advice is boring and reliable — early sentences, counting and place value unlock more downstream learning than anything else on the map. Ten minutes there beats an hour of patching later topics.
If your child seems "behind": on a 27-rung ladder, everyone is mid-ladder. "Behind" almost always means a specific missing rung, not a missing ability — and a missing rung is findable and fixable. Ages on the map are typical, not deadlines.
Explore it yourself
Pick any skill — say fractions on a number line — and walk its chain in either direction. The full graph (every edge with its strength and written reason) is downloadable on the data page under an open licence, and the method page explains what the map does and doesn't claim. An interactive explorer for the whole graph is coming; the chains are already walkable one page at a time.
All curriculum alignments referenced above are candidate alignments — machine-generated and unreviewed (v0.1), not official mappings. How the map was built →